When it comes to finding foreign materials, there are a lot of options available to food processors: X-rays, metal detectors, visual detection systems and manual inspectors, to name a few. But no matter what methods you choose to make sure your products are free of contaminants, it’s crucial to understand exactly how that system will perform and under what conditions. Since many equipment suppliers use different ways of explaining how their system performs, it can get confusing very quickly.
At PPO, we use a relatively simple methodology to evaluate the performance of our Smart Imaging Systems, and compare it to other systems. Ironically, despite its simplicity, it’s called a “Confusion Matrix”.
The Confusion Matrix
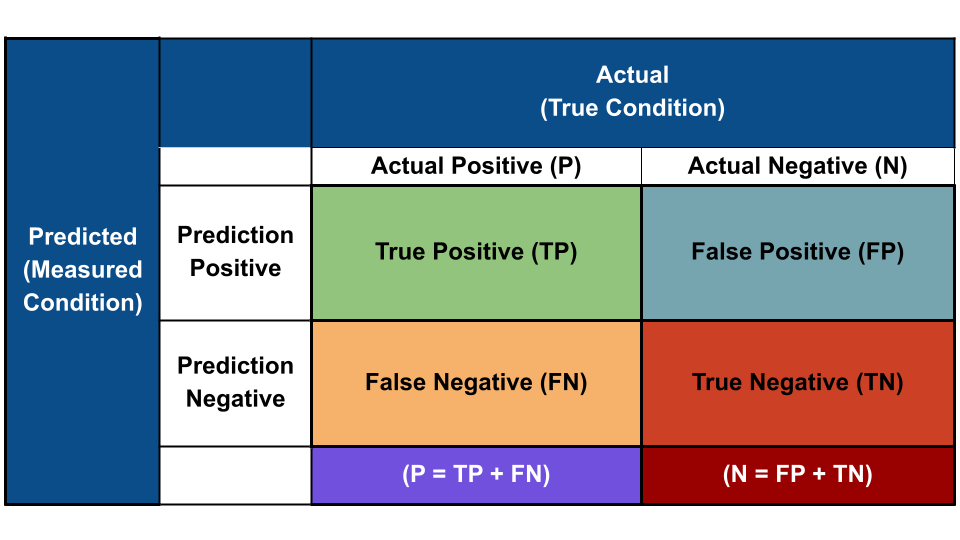
A Confusion Matrix compares the expected outcome of an event, with the actual outcome of an event, with four possible outcomes as shown in the chart below:

As you can see from the matrix, not all detection or non-detection events registered by a detector are correct. So, for example, if we are testing for a disease (like cancer), we need to know how often a particular test will detect cancer when it *IS* present (True Positive), and how often the test will detect cancer when it *IS NOT* present (False Positive).
In the case of foreign materials detection, if a detector finds a foreign material that *isn’t* there (False Positive), or misses a foreign material that *is* there (False Negative), the system isn’t working well for its chosen application.
In the case of foreign materials, as the True Positive rate goes down, more foreign materials are missed and may end up in the hands of consumers. Broadly speaking, this can be mitigated by “turning up the sensitivity” of the detection system. However, doing so may increase the incidence of False Positives. Higher False Positives may lead to throwing away more good product.
The secret to making a good detection system for a specific application lies in carefully balancing the rates of True Positives and False Positives for the customer’s needs.
Therefore, understanding the “Confusion Matrix” results of any detection system is a crucial place to start. As you can imagine, a balance between all the components of the Confusion Matrix is necessary in the selection of a best detection system. But there’s more! We also need to look at the “Detection Curve”, for a further understanding of how effective a particular detector will be.
Effectiveness of a Detector
The effectiveness of any detection system is influenced by some important factors:
-
- Resolution: Resolution is the size of the minimum detectable object. It’s important to remember that this is not simply the size of pixels in the detector! It’s a combination of noise (see “Signal to noise ratio” below), actual system configuration, the product being reviewed, and model algorithms.
- Signal to noise ratio: The signal-to-noise ratio compares the “signal” (information which comes from the material of interest, in this case the product being reviewed), with the “noise” (which comes from various sources and can include anything present which isn’t the material of interest).
- Speed of acquisition: Speed of acquisition measures how fast the detector can process the signals it receives.
- Material being detected: The type of material being detected will have a significant impact on the likelihood of detection. For example, an X-ray system is unlikely to detect cardboard or other low-density materials.
- Presentation of material being detected: Materials that are underneath another object, are presented on an angle, are too similar to the product being inspected, or are partially obstructed, may be more difficult for some detectors to find.
- Environment: Conditions such as temperature and humidity will have a significant effect on detection.
Detection Curves
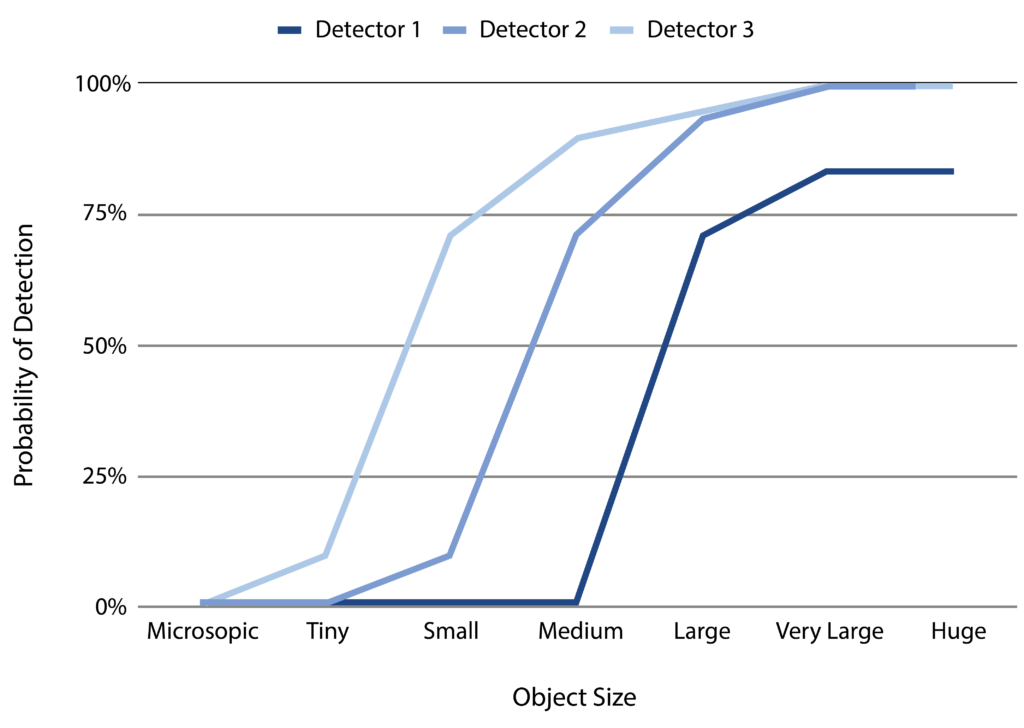
Most detection methods get better at detection as the size of the foreign material increases. We can see this illustrated on a Detection Curve. The Detection Curve below shows the probability of a detection (True Positive from our Confusion Matrix) at different sizes of foreign material.
This chart shows three examples of possible detection curves, depending on the detector being used.

Detection capability can be improved on most detection systems, but that improvement will come at a significant cost: increasing False Positives and therefore increasing rejection of good product.
Hopefully by now, it’s becoming clear why it’s so important to understand both the Detection Curve and the False-Positive/False-Negative rates for any detection system, especially in a food processing plant. Every detection method (x-ray, metal detection, vision systems, manual inspection) will present some trade-off between actual (correct) detection, rejection of good product (False Positive) and missed detections (False Negative).
Comparing both actual detection and False Positive/False Negative rates is the only way to truly understand the capabilities of any detection system – including manual inspection.
If you’re interested in how effective manual inspection really is, please check out our blog post on food inspectors.
And if you’ve got questions about different types of vision systems for automated inspection, we have a blog post AND a webinar for you.
Ready to learn more about PPO’s Smart Imaging System, our Detection Curve and our results from the Confusion Matrix? Get in touch with us today!